Gold Coast Desalination Plant: Difference between revisions
From Desal Wiki
imported>WikiAdmin No edit summary |
imported>WikiAdmin No edit summary |
||
| Line 4: | Line 4: | ||
| total capacity (max) = [[Has Max Capacity::133 ML/day]] | | total capacity (max) = [[Has Max Capacity::133 ML/day]] | ||
| date commissioned = February 2009 | | date commissioned = February 2009 | ||
| feed water TDS = [[Has Feed Water TDS - Low:: | | feed water TDS = [[Has Feed Water TDS - Low::34000 mg/L]] - [[Has Feed Water TDS - High::39000 mg/L]] <ref name="billiton" /> | ||
| product water TDS = [[Has Product Water TDS::140mg/L]] <ref name="crisp" /> | | product water TDS = [[Has Product Water TDS::140mg/L]] <ref name="crisp" /> | ||
| percent of water supply = 27% of South Eastern QLD | | percent of water supply = 27% of South Eastern QLD | ||
Revision as of 22:23, 14 November 2014

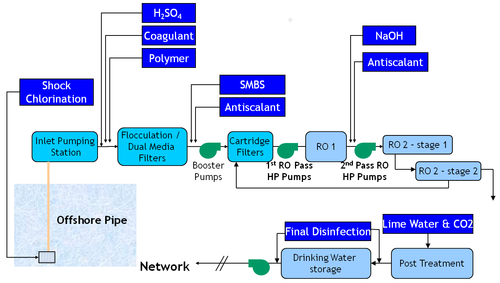
Interactive process flow diagram
Water quality data
| Physical & Chemical Properties | |
|---|---|
| Turbidity: | 7 NTU |
| Cations |
|---|
| Anions |
|---|
References
- ↑ Billiton, BHP. Appendix H3: Comparisons With Other Desalination Plants Olympic Dams Supplementary EIS (pp. 2-5). [1] Accessed November 6th, 2014.
- ↑ Crisp, G. J. (2010). Desalination in Australia. Paper presented at the OC Water Summit, Grand Californian Hotel, Disneyland Resort. [2] Accessed November 6th, 2014.
- ↑ 3.0 3.1 Bellizia, G. (2008). GOLD COAST DESALINATION PROJECT. Paper presented at the 33rd Annual Qld Water Industry Operations Workshop, Indoor Sports Centre, Carrara, Gold Coast. [3] Accessed November 6th, 2014