Gold Coast Desalination Plant: Difference between revisions
From Desal Wiki
imported>WikiAdmin No edit summary |
imported>WikiAdmin No edit summary |
||
| Line 36: | Line 36: | ||
</imagemap> | </imagemap> | ||
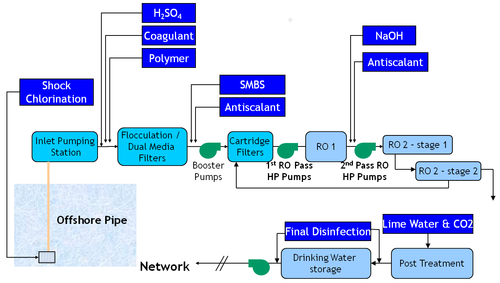
A more detailed PFD is available [{{fullurl:File:Gold-coast-detailed-pfd.png}} here]. | A more detailed PFD is available [{{fullurl:File:Gold-coast-detailed-pfd.png}} here]. Test test test test test test test test test test test test test test test test test test test test test test test test test test test test | ||
===Water quality data=== | ===Water quality data=== | ||
Revision as of 18:42, 7 January 2015

Interactive process flow diagram
A more detailed PFD is available here. Test test test test test test test test test test test test test test test test test test test test test test test test test test test test
Water quality data
| Physical & Chemical Properties | |
|---|---|
| Turbidity: | 7 NTU |
| Cations |
|---|
| Anions |
|---|
References
- ↑ Billiton, BHP. Appendix H3: Comparisons With Other Desalination Plants Olympic Dams Supplementary EIS (pp. 2-5). [1] Accessed November 6th, 2014.
- ↑ Crisp, G. J. (2010). Desalination in Australia. Paper presented at the OC Water Summit, Grand Californian Hotel, Disneyland Resort. [2] Accessed November 6th, 2014.
- ↑ 3.0 3.1 Bellizia, G. (2008). GOLD COAST DESALINATION PROJECT. Paper presented at the 33rd Annual Qld Water Industry Operations Workshop, Indoor Sports Centre, Carrara, Gold Coast. [3] Accessed November 6th, 2014