Gold Coast Desalination Plant: Difference between revisions
From Desal Wiki
imported>WikiAdmin (Created page with "{{Infobox - Desal Plant Profile | image_name = Gold coast desal plant overview.png | caption = Labelled aerial photo of {{PAGENAME}} | total capacity (max) = 133ML/day ...") |
imported>WikiAdmin No edit summary |
||
| (28 intermediate revisions by the same user not shown) | |||
| Line 2: | Line 2: | ||
| image_name = Gold coast desal plant overview.png | | image_name = Gold coast desal plant overview.png | ||
| caption = Labelled aerial photo of {{PAGENAME}} | | caption = Labelled aerial photo of {{PAGENAME}} | ||
| total capacity (max) = | | total capacity (max) = [[Has Max Capacity::133 ML/day]] | ||
| date commissioned = February 2009 | | date commissioned = February 2009 | ||
| feed water | | feed water TDS = [[Has Feed Water TDS - Low::34000 mg/L]] - [[Has Feed Water TDS - High::39000 mg/L]] <ref name="billiton" /> | ||
| product water | | product water TDS = [[Has Product Water TDS::140mg/L]] <ref name="crisp" /> | ||
| percent of water supply = 27% of South Eastern QLD | | percent of water supply = 27% of South Eastern QLD | ||
| feed water temperature (low) = [[Has Feed Water Temp - Low::17°C]] | | feed water temperature (low) = [[Has Feed Water Temp - Low::17°C]] | ||
| Line 26: | Line 26: | ||
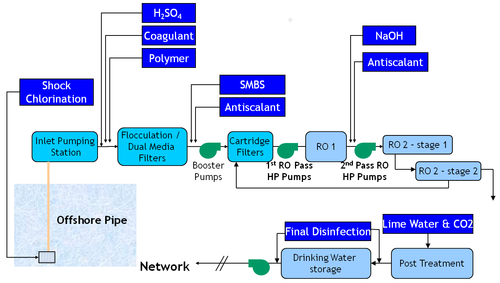
===Interactive process flow diagram=== | ===Interactive process flow diagram=== | ||
<imagemap> | <imagemap> | ||
Image: | Image:Pfd-gold_coast.png|none|thumb|500px | ||
rect 10 202 264 698 [[Gold Coast Desalination Plant - Intake|Intake]] | |||
rect 10 202 264 698 [[ | rect 238 480 362 700 [[Gold Coast Desalination Plant - Intake|Intake]] | ||
rect 238 480 362 700 [[ | rect 272 4 722 438 [[Gold Coast Desalination Plant - Pretreatment|Pretreatment]] | ||
rect 272 4 722 438 [[ | rect 886 48 1156 216 [[Gold Coast Desalination Plant - Cleaning|Cleaning]] | ||
rect 886 48 1156 216 [[ | rect 782 336 1274 490 [[Gold Coast Desalination Plant - RO|RO]] | ||
rect 782 336 1274 490 [[ | rect 720 550 1254 738 [[Gold Coast Desalination Plant - Post-treatment|Post-treatment]] | ||
rect 720 550 1254 738 [[ | |||
desc bottom-left | desc bottom-left | ||
</imagemap> | </imagemap> | ||
A more detailed PFD is available [{{fullurl:File:Gold-coast-detailed-pfd.png}} here]. | |||
===Water quality data=== | ===Water quality data=== | ||
| Line 79: | Line 80: | ||
===References=== | ===References=== | ||
< | <references> | ||
<ref name="billiton">Billiton, BHP. Appendix H3: Comparisons With Other Desalination Plants Olympic Dams Supplementary EIS (pp. 2-5). http://www.bhpbilliton.com/home/society/regulatory/Documents/Olympic%20Dam%20Supplementary%20EIS/Appendices/Appendix%20H3_Comparisons%20with%20other%20Desalination%20Plants.pdf Accessed November 6th, 2014.</ref> | <ref name="billiton">Billiton, BHP. Appendix H3: Comparisons With Other Desalination Plants Olympic Dams Supplementary EIS (pp. 2-5). [http://www.bhpbilliton.com/home/society/regulatory/Documents/Olympic%20Dam%20Supplementary%20EIS/Appendices/Appendix%20H3_Comparisons%20with%20other%20Desalination%20Plants.pdf] Accessed November 6th, 2014.</ref> | ||
<ref name="crisp">Crisp, G. J. (2010). Desalination in Australia. Paper presented at the OC Water Summit, Grand Californian Hotel, Disneyland Resort. http://www.mwdoc.com/OCWaterSummit/Presentations/GHD%20Ocean%20Desalination.pdf Accessed November 6th, 2014.</ref> | <ref name="crisp">Crisp, G. J. (2010). Desalination in Australia. Paper presented at the OC Water Summit, Grand Californian Hotel, Disneyland Resort. [http://www.mwdoc.com/OCWaterSummit/Presentations/GHD%20Ocean%20Desalination.pdf] Accessed November 6th, 2014.</ref> | ||
<ref name="bellizia">Bellizia, G. (2008). GOLD COAST DESALINATION PROJECT. Paper presented at the 33rd Annual Qld Water Industry Operations Workshop, Indoor Sports Centre, Carrara, Gold Coast. [http://www.wioa.org.au/conference_papers/08_Qld/documents/GeorgeBellizia_000.pdf] Accessed November 6th, 2014</ref> | |||
</references> | |||
Latest revision as of 18:44, 7 January 2015

Interactive process flow diagram
A more detailed PFD is available here.
Water quality data
| Physical & Chemical Properties | |
|---|---|
| Turbidity: | 7 NTU |
| Cations |
|---|
| Anions |
|---|
References
- ↑ Billiton, BHP. Appendix H3: Comparisons With Other Desalination Plants Olympic Dams Supplementary EIS (pp. 2-5). [1] Accessed November 6th, 2014.
- ↑ Crisp, G. J. (2010). Desalination in Australia. Paper presented at the OC Water Summit, Grand Californian Hotel, Disneyland Resort. [2] Accessed November 6th, 2014.
- ↑ 3.0 3.1 Bellizia, G. (2008). GOLD COAST DESALINATION PROJECT. Paper presented at the 33rd Annual Qld Water Industry Operations Workshop, Indoor Sports Centre, Carrara, Gold Coast. [3] Accessed November 6th, 2014