Membrane Autopsy Techniques: Difference between revisions
From Desal Wiki
imported>WikiAdmin (Created page with "Category:Training Material for Operators Category:Resources") |
imported>WikiAdmin No edit summary |
||
| Line 1: | Line 1: | ||
==Purpose== | |||
<div class="align-right"> | |||
<gallery widths=225px heights=225px> | |||
File:Optagon model.png|OPTAGON Model | |||
File:Asset resilience.png|Asset Resilience | |||
</gallery> | |||
</div> | |||
*Resilience is a system’s ability to maintain routine function even under unexpected circumstances.It is an essential factor in ensuring continuous process throughput whilst remaining compliant with strict water discharge guidelines. | |||
*Resilience modelling tools have been widely used in the Petrochemical, Oil and Gas, and Aviation industries to model process reliability and safety over the last 15 years. | |||
*No standard resilience modelling method has been developed for a potable reuse scheme. | |||
*Study used a resilience modelling tool from the Oil and Gas industry, GL Noble Denton’s (GLND) OPTAGON Simulation Package | |||
*OPTAGON is GLND’s Monte Carlo-based Reliability, Availability and Maintainability (RAM) simulation tool which is capable of modelling the performance of asset. | |||
*With user-variated real-time data, OPTAGON is able to accurately predict equipment failure and system resilience. | |||
==Objective== | |||
*Develop a mechanical resilience model for dual membrane plants (MF/UF + RO) using data from large scale (>10 MLD) plants with long operating history (7-10 yrs) | |||
*Develop “What-if” scenarios for resilience model’s sensitivity based on confirmed cases of drinking water plant failure resulting in pathogen infection | |||
*Quantify process resilience and predict process equipment failure using resilience model. | |||
==Common Failures in Drinking Water Systems== | |||
*GIDEON database catalogued >2000 confirmed pathogenic outbreaks from 2003 to 2013. | |||
*30% of the outbreaks were associated with protozoan parasites. | |||
*The most common type of failure was an incident in the catchment area in conjunction with an inadequate process design. | |||
*Second most common type of failure occurred in the distribution system followed by an inadequate management framework and operational error. | |||
*Poor asset management and failures highlight the need and importance of resilience modelling in the water industry. | |||
[[File:Gideon map.png|thumb|600px|left]] | |||
<html xmlns="http://www.w3.org/1999/xhtml"> | |||
<head> | |||
<meta http-equiv="content-type" content="text/html; charset=utf-8"/> | |||
<script type="text/javascript" src="//www.google.com/jsapi"></script> | |||
<script type="text/javascript"> | |||
google.load('visualization', '1', {packages: ['corechart']}); | |||
</script> | |||
<script type="text/javascript"> | |||
function drawVisualization() { | |||
// Create and populate the data table. | |||
var data1 = google.visualization.arrayToDataTable([ | |||
['Pathogen', 'Outbreak (%)'], | |||
['Bacterial', 23], | |||
['Protozoan', 30], | |||
['Viral', 26], | |||
['Unknown', 9], | |||
['Mixed Aetiology', 12] | |||
]); | |||
var data2 = google.visualization.arrayToDataTable([ | |||
['Causes', 'Failure (%)'], | |||
['Management', 9], | |||
['Breakage', 17], | |||
['Design', 60], | |||
['Monitoring/Maintenance', 6], | |||
['Operational/Human Error', 8] | |||
]); | |||
// Create and draw the visualization. | |||
new google.visualization.PieChart(document.getElementById('visualization1')). | |||
draw(data1, {title:"Pathogen Outbreaks"}); | |||
new google.visualization.PieChart(document.getElementById('visualization2')). | |||
draw(data2, {title:"Causes of Failure"}); | |||
} | |||
google.setOnLoadCallback(drawVisualization); | |||
</script> | |||
<style> | |||
.chart-container { | |||
width: 100%; | |||
margin: 0 auto; | |||
text-align: center; | |||
} | |||
.pie-chart-container { | |||
width: 372px; | |||
margin: 0 auto; | |||
text-align: center; | |||
display: -moz-inline-stack; | |||
display: inline-block; | |||
zoom: 1; | |||
*display: inline; | |||
} | |||
</style> | |||
</head> | |||
<body style="font-family: Arial;border: 0 none;"> | |||
<div class="chart-container"> | |||
<div class="pie-chart-container"> | |||
<div id="visualization1" style="width: 372px; height: 224px;"></div> | |||
</div> | |||
<div class="pie-chart-container"> | |||
<div id="visualization2" style="width: 372px; height: 224px;"></div> | |||
</div> | |||
</div> | |||
</body> | |||
</html> | |||
<p> | |||
==Supporting Evidence== | |||
==Modelling Process== | |||
===Data Sourcing and Collection=== | |||
*Equipment failure and performance data is sourced from 7 water recycling plants worldwide. | |||
*Relevant information is collected from a wide array of data sources. | |||
<!-- Map -> Table --> | |||
===Data Analysis and Mapping=== | |||
*Cataloged equipment data is sorted and mapped according to process equipment specified in the model (Reference Plant). | |||
*Equipment arranged with design and operational capacities based on functional location. | |||
*Operation & Maintenance (O&M) Manuals provide vital information on equipment availability. | |||
*MTBF and MTTR are also calculated if not previously provided. | |||
*Equipment criticality is determined based on failure and maintenance data. | |||
<center> | |||
<gallery widths=400px heights=300px> | |||
File:Equipment table spreadsheet.png | |||
File:ReferencePlant-AWRCoE-ProcessDesignDiagram.png | |||
</gallery> | |||
</center> | |||
===Resilience Modelling and Sensitivity Analysis=== | |||
*Mapped data becomes input variables for OPTAGON to model asset’s mechanical resilience. | |||
*Monte Carlo simulations of 10,000 realisations ensure confidence of modelling results. | |||
*Results also demonstrate equipment interdependency. | |||
*Modelling results would quantify the asset’s overall reliability and resilience. | |||
*Sensitivity analysis would further highlight which input variable would have the greatest impact on the system. | |||
*“What-if” scenarios would test the robustness of the reference plant and aid with process optimisation. | |||
<center> | |||
'''Resilience = ƒ (Availability, Performance)'''<br> | |||
'''Availability = ƒ (Reliability, Maintainability)'''<br> | |||
'''Risk = ƒ (Likelihood, Consequence)''' | |||
</center> | |||
===Outputs=== | |||
*OPTAGON can model complex water recycling systems with high level of accuracy and consistency. | |||
*Modelling results would be able to quantify asset resilience, criticality and risk. | |||
*Resilience modelling can predict and improve asset performance throughout asset’s lifespan. | |||
*Sensitivity analysis would support asset management decisions and aid in efficiency and profitability. | |||
*Reference model can also be used to provide insight to specific failure modes and resulting effects. | |||
<center> | |||
<gallery widths=400px heights=300px> | |||
File:Resilience modelling monte carlo.png | |||
File:Sensitivity analysis.png | |||
</gallery> | |||
</center> | |||
[[Category:Training Material for Operators]] | [[Category:Training Material for Operators]] | ||
[[Category:Resources]] | [[Category:Resources]] | ||
Revision as of 20:14, 4 September 2014
Purpose
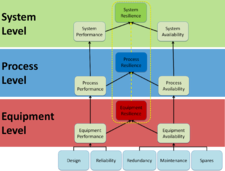
OPTAGON Model
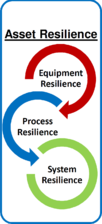
Asset Resilience


- Resilience is a system’s ability to maintain routine function even under unexpected circumstances.It is an essential factor in ensuring continuous process throughput whilst remaining compliant with strict water discharge guidelines.
- Resilience modelling tools have been widely used in the Petrochemical, Oil and Gas, and Aviation industries to model process reliability and safety over the last 15 years.
- No standard resilience modelling method has been developed for a potable reuse scheme.
- Study used a resilience modelling tool from the Oil and Gas industry, GL Noble Denton’s (GLND) OPTAGON Simulation Package
- OPTAGON is GLND’s Monte Carlo-based Reliability, Availability and Maintainability (RAM) simulation tool which is capable of modelling the performance of asset.
- With user-variated real-time data, OPTAGON is able to accurately predict equipment failure and system resilience.
Objective
- Develop a mechanical resilience model for dual membrane plants (MF/UF + RO) using data from large scale (>10 MLD) plants with long operating history (7-10 yrs)
- Develop “What-if” scenarios for resilience model’s sensitivity based on confirmed cases of drinking water plant failure resulting in pathogen infection
- Quantify process resilience and predict process equipment failure using resilience model.
Common Failures in Drinking Water Systems
- GIDEON database catalogued >2000 confirmed pathogenic outbreaks from 2003 to 2013.
- 30% of the outbreaks were associated with protozoan parasites.
- The most common type of failure was an incident in the catchment area in conjunction with an inadequate process design.
- Second most common type of failure occurred in the distribution system followed by an inadequate management framework and operational error.
- Poor asset management and failures highlight the need and importance of resilience modelling in the water industry.

Supporting Evidence
Modelling Process
Data Sourcing and Collection
- Equipment failure and performance data is sourced from 7 water recycling plants worldwide.
- Relevant information is collected from a wide array of data sources.
Data Analysis and Mapping
- Cataloged equipment data is sorted and mapped according to process equipment specified in the model (Reference Plant).
- Equipment arranged with design and operational capacities based on functional location.
- Operation & Maintenance (O&M) Manuals provide vital information on equipment availability.
- MTBF and MTTR are also calculated if not previously provided.
- Equipment criticality is determined based on failure and maintenance data.


Resilience Modelling and Sensitivity Analysis
- Mapped data becomes input variables for OPTAGON to model asset’s mechanical resilience.
- Monte Carlo simulations of 10,000 realisations ensure confidence of modelling results.
- Results also demonstrate equipment interdependency.
- Modelling results would quantify the asset’s overall reliability and resilience.
- Sensitivity analysis would further highlight which input variable would have the greatest impact on the system.
- “What-if” scenarios would test the robustness of the reference plant and aid with process optimisation.
Resilience = ƒ (Availability, Performance)
Availability = ƒ (Reliability, Maintainability)
Risk = ƒ (Likelihood, Consequence)
Outputs
- OPTAGON can model complex water recycling systems with high level of accuracy and consistency.
- Modelling results would be able to quantify asset resilience, criticality and risk.
- Resilience modelling can predict and improve asset performance throughout asset’s lifespan.
- Sensitivity analysis would support asset management decisions and aid in efficiency and profitability.
- Reference model can also be used to provide insight to specific failure modes and resulting effects.


