|
|
| (5 intermediate revisions by one user not shown) |
| Line 1: |
Line 1: |
| − | ==Purpose== | + | ==Characterisation== |
| − | <div class="align-right">
| + | Membrane properties can be evaluated by a range of different techniques. Below is a list of techniques commonly used. |
| − | <gallery widths=225px heights=225px>
| + | |
| − | File:Optagon model.png|OPTAGON Model
| + | |
| − | File:Asset resilience.png|Asset Resilience
| + | |
| − | </gallery>
| + | |
| − | </div>
| + | |
| − | *Resilience is a system’s ability to maintain routine function even under unexpected circumstances.It is an essential factor in ensuring continuous process throughput whilst remaining compliant with strict water discharge guidelines.
| + | |
| − | *Resilience modelling tools have been widely used in the Petrochemical, Oil and Gas, and Aviation industries to model process reliability and safety over the last 15 years.
| + | |
| − | *No standard resilience modelling method has been developed for a potable reuse scheme.
| + | |
| | | | |
| − | *Study used a resilience modelling tool from the Oil and Gas industry, GL Noble Denton’s (GLND) OPTAGON Simulation Package
| + | <DPL> |
| − | *OPTAGON is GLND’s Monte Carlo-based Reliability, Availability and Maintainability (RAM) simulation tool which is capable of modelling the performance of asset.
| + | category=Characterisation |
| − | *With user-variated real-time data, OPTAGON is able to accurately predict equipment failure and system resilience.
| + | ordermethod=counter |
| | + | order=descending |
| | + | addpagecounter=true |
| | + | </DPL> |
| | + | [http://membranes.edu.au/wiki/index.php/Category:Characterisation See MemRe list] |
| | | | |
| − | ==Objective== | + | ==Visualisation== |
| − | *Develop a mechanical resilience model for dual membrane plants (MF/UF + RO) using data from large scale (>10 MLD) plants with long operating history (7-10 yrs)
| + | Visualisation methods may be qualitative descriptions in themselves or utilised as methods for characterisation of properties. Current visualisation methods which are available are: |
| − | *Develop “What-if” scenarios for resilience model’s sensitivity based on confirmed cases of drinking water plant failure resulting in pathogen infection
| + | |
| − | *Quantify process resilience and predict process equipment failure using resilience model.
| + | |
| | | | |
| − | ==Common Failures in Drinking Water Systems== | + | <DPL> |
| − | *GIDEON database catalogued >2000 confirmed pathogenic outbreaks from 2003 to 2013.
| + | category=Visualisation |
| − | *30% of the outbreaks were associated with protozoan parasites.
| + | ordermethod=counter |
| − | *The most common type of failure was an incident in the catchment area in conjunction with an inadequate process design.
| + | order=descending |
| − | *Second most common type of failure occurred in the distribution system followed by an inadequate management framework and operational error.
| + | addpagecounter=true |
| − | *Poor asset management and failures highlight the need and importance of resilience modelling in the water industry.
| + | </DPL> |
| | + | [http://membranes.edu.au/wiki/index.php/Category:Visualisation See MemRe list] |
| | | | |
| − | [[File:Gideon map.png|thumb|600px|left]]
| + | ==Property== |
| | + | The Property category contains a list of common properties used for membrane material characterisation. This category also defines the available properties that may be included in the digital repository. If you cannot find the property you are after please add it. |
| | | | |
| − | <html xmlns="http://www.w3.org/1999/xhtml"> | + | <DPL> |
| − | <head> | + | category=Property |
| − | <meta http-equiv="content-type" content="text/html; charset=utf-8"/>
| + | ordermethod=counter |
| − | <script type="text/javascript" src="//www.google.com/jsapi"></script>
| + | order=descending |
| − | <script type="text/javascript">
| + | addpagecounter=true |
| − | google.load('visualization', '1', {packages: ['corechart']});
| + | </DPL> |
| − | </script>
| + | [http://membranes.edu.au/wiki/index.php/Category:Property See MemRe list] |
| − | <script type="text/javascript">
| + | |
| − | function drawVisualization() {
| + | |
| − | // Create and populate the data table.
| + | |
| − | var data1 = google.visualization.arrayToDataTable([
| + | |
| − | ['Pathogen', 'Outbreak (%)'],
| + | |
| − | ['Bacterial', 23],
| + | |
| − | ['Protozoan', 30],
| + | |
| − | ['Viral', 26],
| + | |
| − | ['Unknown', 9],
| + | |
| − | ['Mixed Aetiology', 12]
| + | |
| − | ]);
| + | |
| − | var data2 = google.visualization.arrayToDataTable([
| + | |
| − | ['Causes', 'Failure (%)'],
| + | |
| − | ['Management', 9],
| + | |
| − | ['Breakage', 17],
| + | |
| − | ['Design', 60],
| + | |
| − | ['Monitoring/Maintenance', 6],
| + | |
| − | ['Operational/Human Error', 8]
| + | |
| − | ]);
| + | |
| − |
| + | |
| − | // Create and draw the visualization.
| + | |
| − | new google.visualization.PieChart(document.getElementById('visualization1')).
| + | |
| − | draw(data1, {title:"Pathogen Outbreaks"});
| + | |
| − | new google.visualization.PieChart(document.getElementById('visualization2')).
| + | |
| − | draw(data2, {title:"Causes of Failure"});
| + | |
| − | }
| + | |
| − |
| + | |
| − | | + | |
| − | google.setOnLoadCallback(drawVisualization);
| + | |
| − | </script>
| + | |
| − | <style>
| + | |
| − | .chart-container {
| + | |
| − | width: 100%;
| + | |
| − | margin: 0 auto;
| + | |
| − | text-align: center;
| + | |
| − | }
| + | |
| − | .pie-chart-container {
| + | |
| − | width: 372px;
| + | |
| − | margin: 0 auto;
| + | |
| − | text-align: center;
| + | |
| − | display: -moz-inline-stack;
| + | |
| − | display: inline-block;
| + | |
| − | zoom: 1;
| + | |
| − | *display: inline;
| + | |
| − | }
| + | |
| − | </style>
| + | |
| − | </head>
| + | |
| − | <body style="font-family: Arial;border: 0 none;">
| + | |
| − | <div class="chart-container">
| + | |
| − | <div class="pie-chart-container">
| + | |
| − | <div id="visualization1" style="width: 372px; height: 224px;"></div>
| + | |
| − | </div>
| + | |
| − | <div class="pie-chart-container">
| + | |
| − | <div id="visualization2" style="width: 372px; height: 224px;"></div>
| + | |
| − | </div>
| + | |
| − | </div>
| + | |
| − | </body>
| + | |
| − | </html>
| + | |
| − | <p>
| + | |
| − | | + | |
| − | ==Supporting Evidence==
| + | |
| − | | + | |
| − | ==Modelling Process==
| + | |
| − | | + | |
| − | | + | |
| − | ===Data Sourcing and Collection===
| + | |
| − | *Equipment failure and performance data is sourced from 7 water recycling plants worldwide.
| + | |
| − | *Relevant information is collected from a wide array of data sources.
| + | |
| − | | + | |
| − | <!-- Map -> Table -->
| + | |
| − | | + | |
| − | ===Data Analysis and Mapping===
| + | |
| − | *Cataloged equipment data is sorted and mapped according to process equipment specified in the model (Reference Plant).
| + | |
| − | *Equipment arranged with design and operational capacities based on functional location.
| + | |
| − | *Operation & Maintenance (O&M) Manuals provide vital information on equipment availability.
| + | |
| − | *MTBF and MTTR are also calculated if not previously provided.
| + | |
| − | *Equipment criticality is determined based on failure and maintenance data.
| + | |
| | | | |
| | + | ==Membrane Autopsy Posters== |
| | <center> | | <center> |
| − | <gallery widths=400px heights=300px> | + | <gallery mode="traditional" widths=600px heights=900px> |
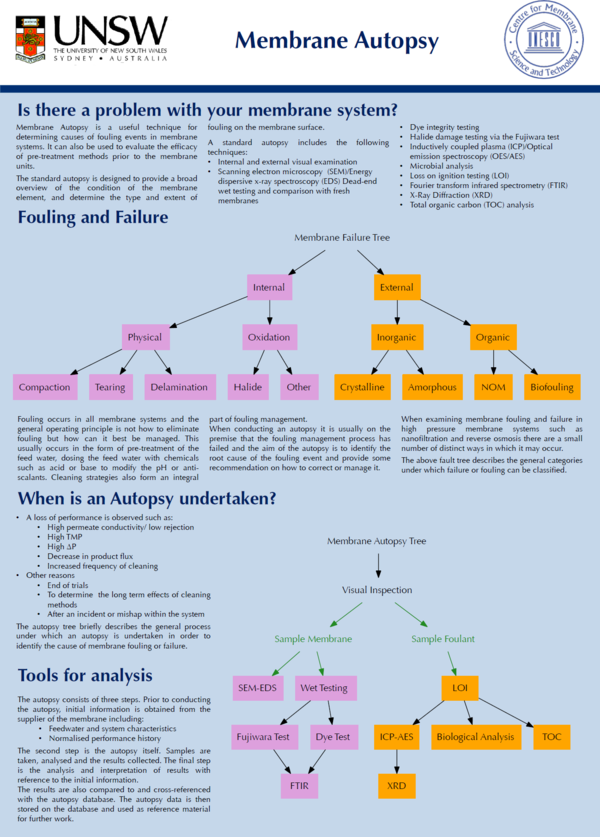
| − | File:Equipment table spreadsheet.png | + | File:1 Autopsy Introduction.png| [[Media:1 Autopsy Introduction.pdf|Introduction to Membrane Autopsy]]|link={{filepath:1 Autopsy Introduction.pdf}} |
| − | File:ReferencePlant-AWRCoE-ProcessDesignDiagram.png
| + | |
| | </gallery> | | </gallery> |
| | </center> | | </center> |
| − |
| |
| − |
| |
| − | ===Resilience Modelling and Sensitivity Analysis===
| |
| − | *Mapped data becomes input variables for OPTAGON to model asset’s mechanical resilience.
| |
| − | *Monte Carlo simulations of 10,000 realisations ensure confidence of modelling results.
| |
| − | *Results also demonstrate equipment interdependency.
| |
| − | *Modelling results would quantify the asset’s overall reliability and resilience.
| |
| − | *Sensitivity analysis would further highlight which input variable would have the greatest impact on the system.
| |
| − | *“What-if” scenarios would test the robustness of the reference plant and aid with process optimisation.
| |
| − |
| |
| | <center> | | <center> |
| − | '''Resilience = ƒ (Availability, Performance)'''<br>
| + | <gallery mode="traditional" widths=600px heights=900px> |
| − | '''Availability = ƒ (Reliability, Maintainability)'''<br>
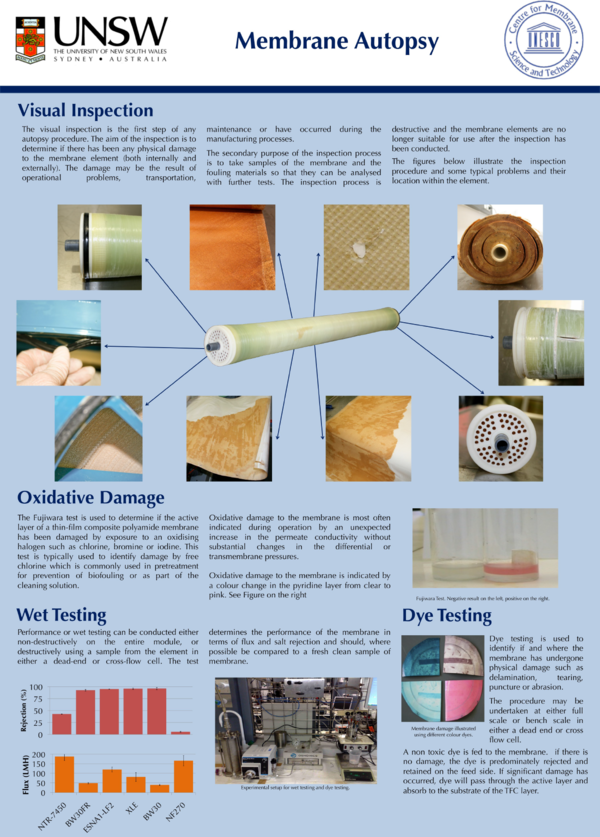
| + | File:2 Visual Inspection.png| [[Media:2 Visual Inspection.pdf|Visual Inspection]]|link={{filepath:2 Visual Inspection.pdf}} |
| − | '''Risk = ƒ (Likelihood, Consequence)'''
| + | </gallery> |
| | </center> | | </center> |
| − |
| |
| − | ===Outputs===
| |
| − | *OPTAGON can model complex water recycling systems with high level of accuracy and consistency.
| |
| − | *Modelling results would be able to quantify asset resilience, criticality and risk.
| |
| − | *Resilience modelling can predict and improve asset performance throughout asset’s lifespan.
| |
| − | *Sensitivity analysis would support asset management decisions and aid in efficiency and profitability.
| |
| − | *Reference model can also be used to provide insight to specific failure modes and resulting effects.
| |
| − |
| |
| | <center> | | <center> |
| − | <gallery widths=400px heights=300px> | + | <gallery mode="traditional" widths=600px heights=900px> |
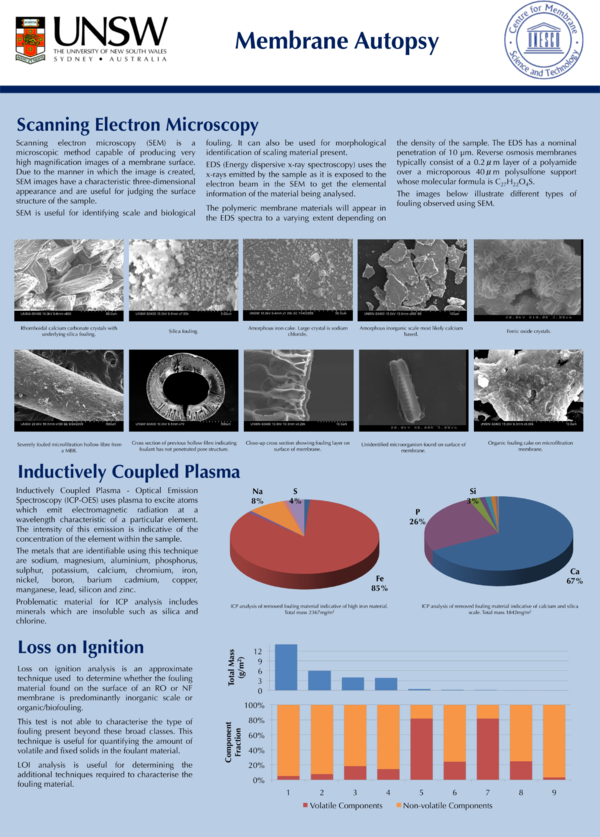
| − | File:Resilience modelling monte carlo.png | + | File:3 SEM-LOI-ICP.png| [[Media:3 SEM-LOI-ICP.pdf|SEM, LOI, and ICP]]|link={{filepath:3 SEM-LOI-ICP.pdf}} |
| − | File:Sensitivity analysis.png
| + | |
| | </gallery> | | </gallery> |
| | </center> | | </center> |
| − |
| |
| − |
| |
| | [[Category:Training Material for Operators]] | | [[Category:Training Material for Operators]] |
| | [[Category:Resources]] | | [[Category:Resources]] |
Membrane properties can be evaluated by a range of different techniques. Below is a list of techniques commonly used.
Visualisation methods may be qualitative descriptions in themselves or utilised as methods for characterisation of properties. Current visualisation methods which are available are:
The Property category contains a list of common properties used for membrane material characterisation. This category also defines the available properties that may be included in the digital repository. If you cannot find the property you are after please add it.